
Every time AI Insurance rates a quote, the calculation is logged automatically. The Rating Run Logs tab of the admin area is the browser for those logs — the place to answer “why did this quote price the way it did?”: see exactly what went into a run, what came out, and whether anything failed. Open it by selecting your company name at the bottom of the left sidebar, then the Rating Run Logs tab.
Any role that can read company data can browse rating run logs — it’s a read-only diagnostic surface. What the runs themselves calculate depends on how your company’s rating is configured.

The run list

Runs are listed newest first, 25 per page.
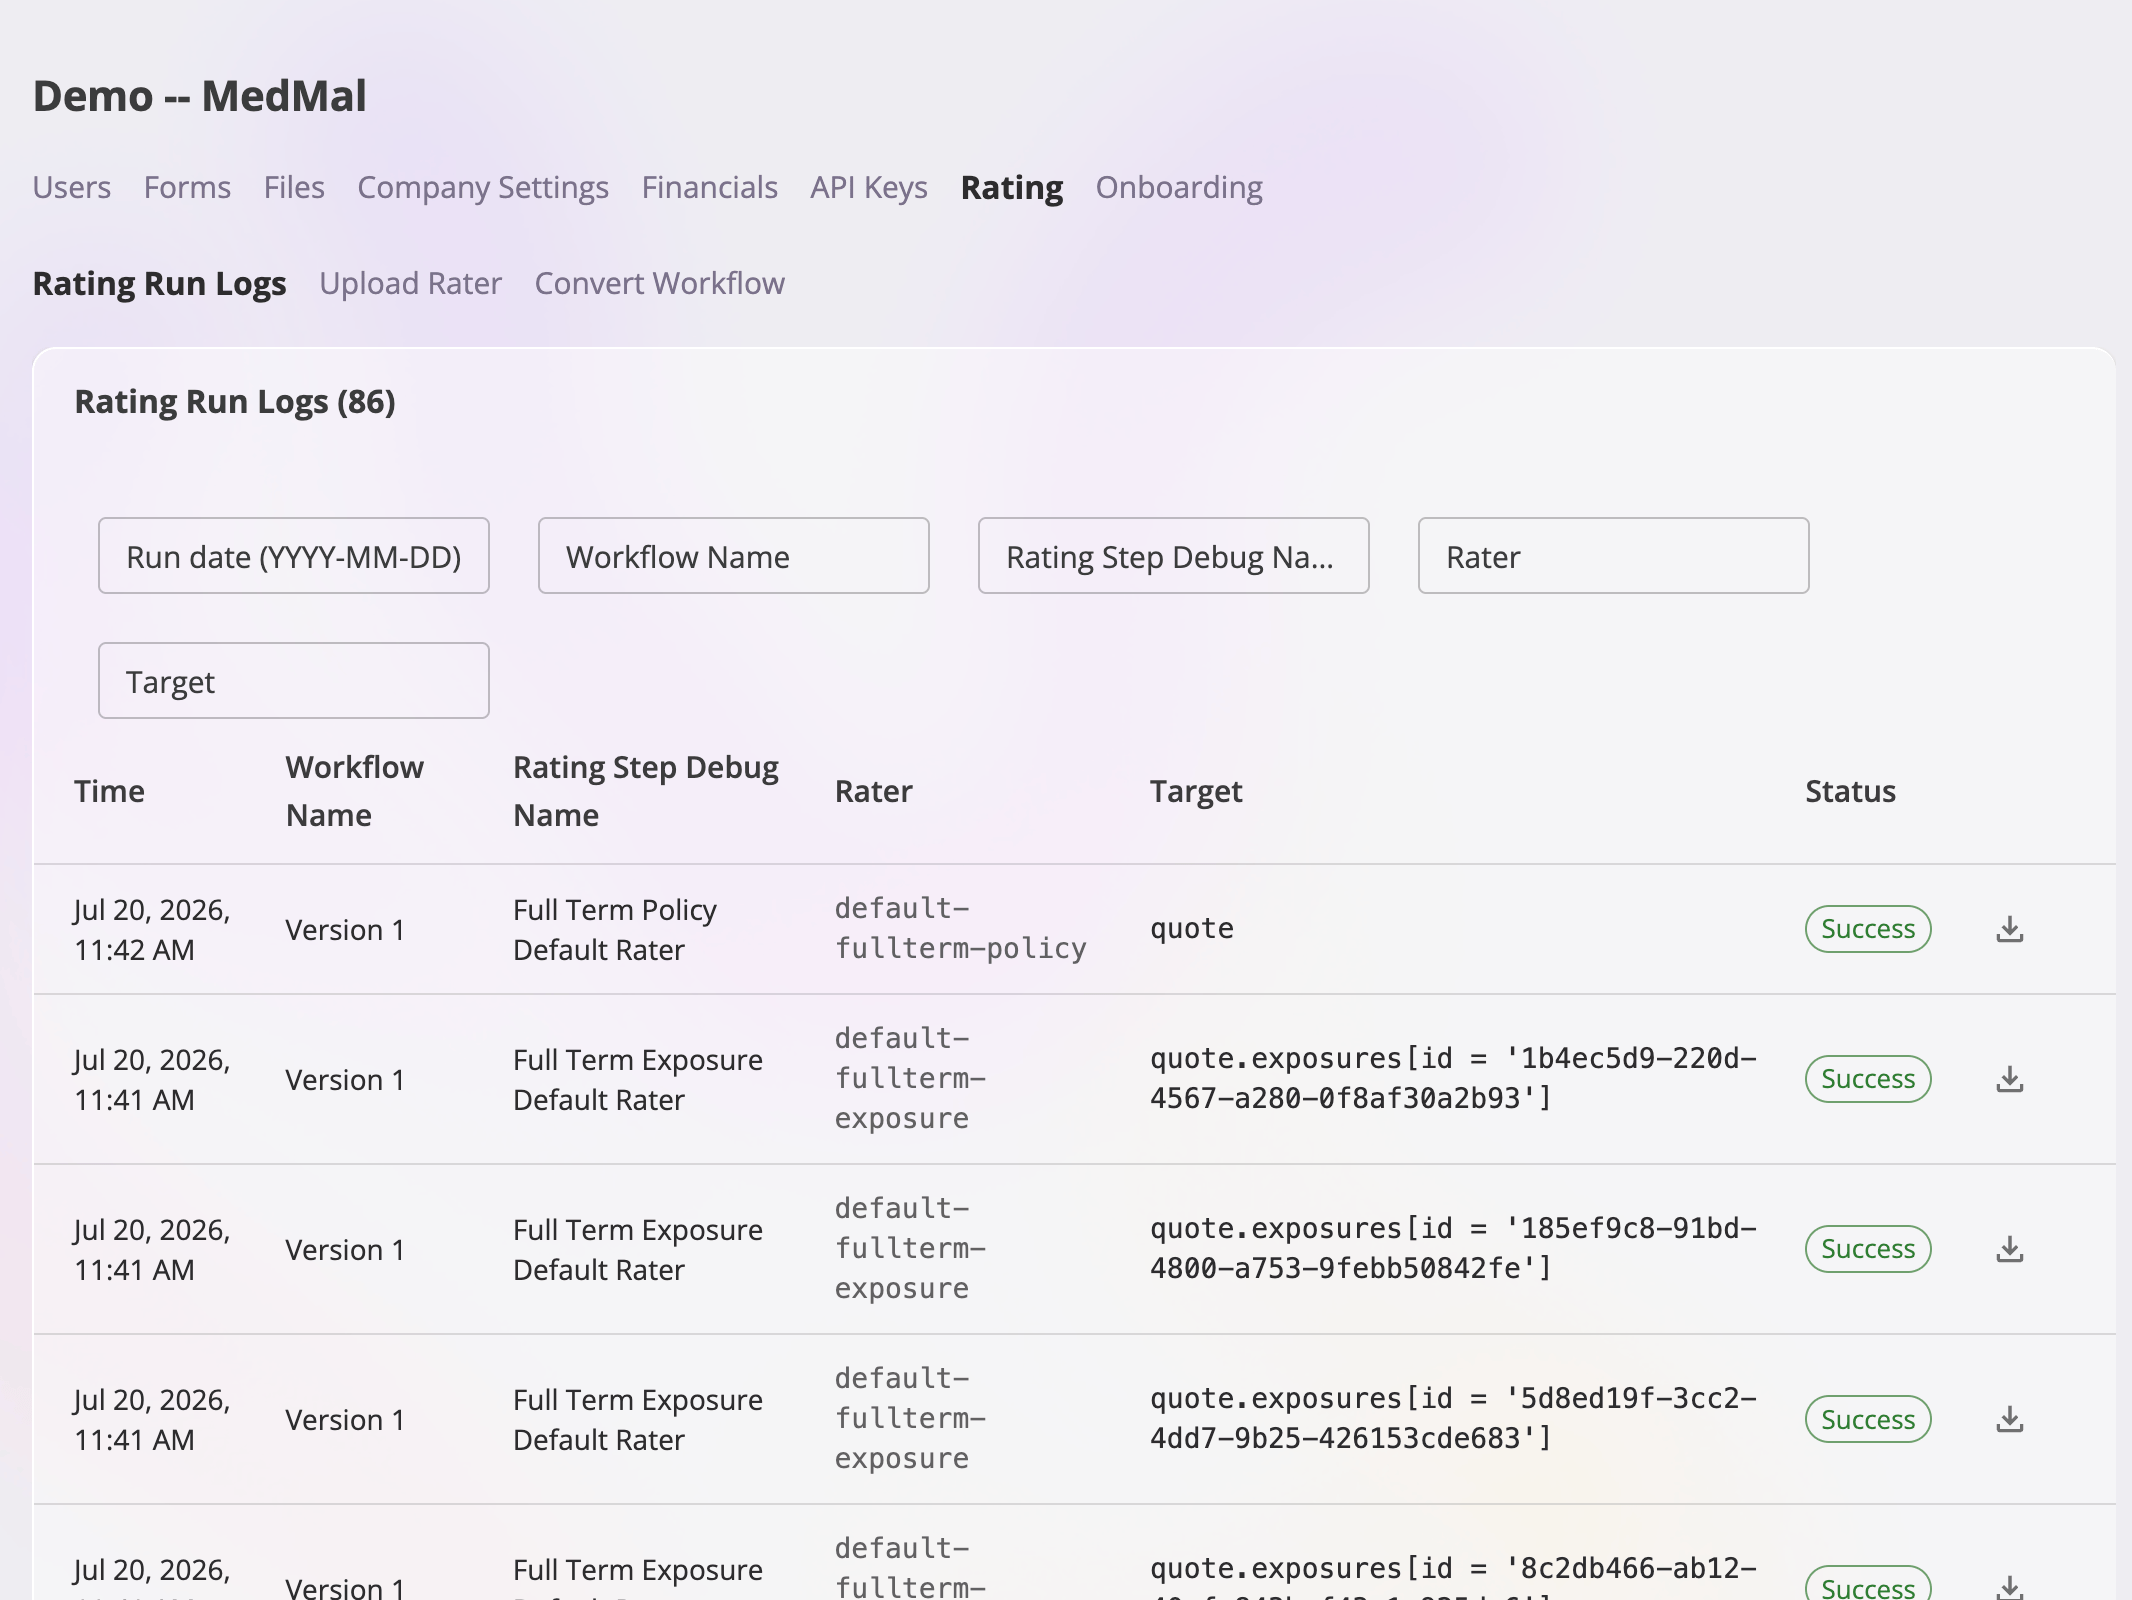
The Rating Run Logs tab showing filter fields for run date, workflow name, rating step debug name, rater, and target above a table with Time, Workflow Name, Rating Step Debug Name, Rater, Target, and Status columns; each row ends with a download icon.

The run list: one row per rating run, with filters and a per-row export button.

A successful run that produced errors in individual output cells also shows an output-error count on its detail view, so a “green” run with bad cells is still visible. Above the table, free-text filters narrow the list by any column: Run date (as YYYY-MM-DD), Workflow Name, Rating Step Debug Name, Rater, and Target. Filters match anywhere in the value and ignore case; changing one takes you back to the first page. To open a run, select its row. To export without opening it, use the download icon at the end of the row — it offers the same export menu as the detail view.

What a run shows

A run’s detail view has three parts: the metadata panel, and two artifacts.
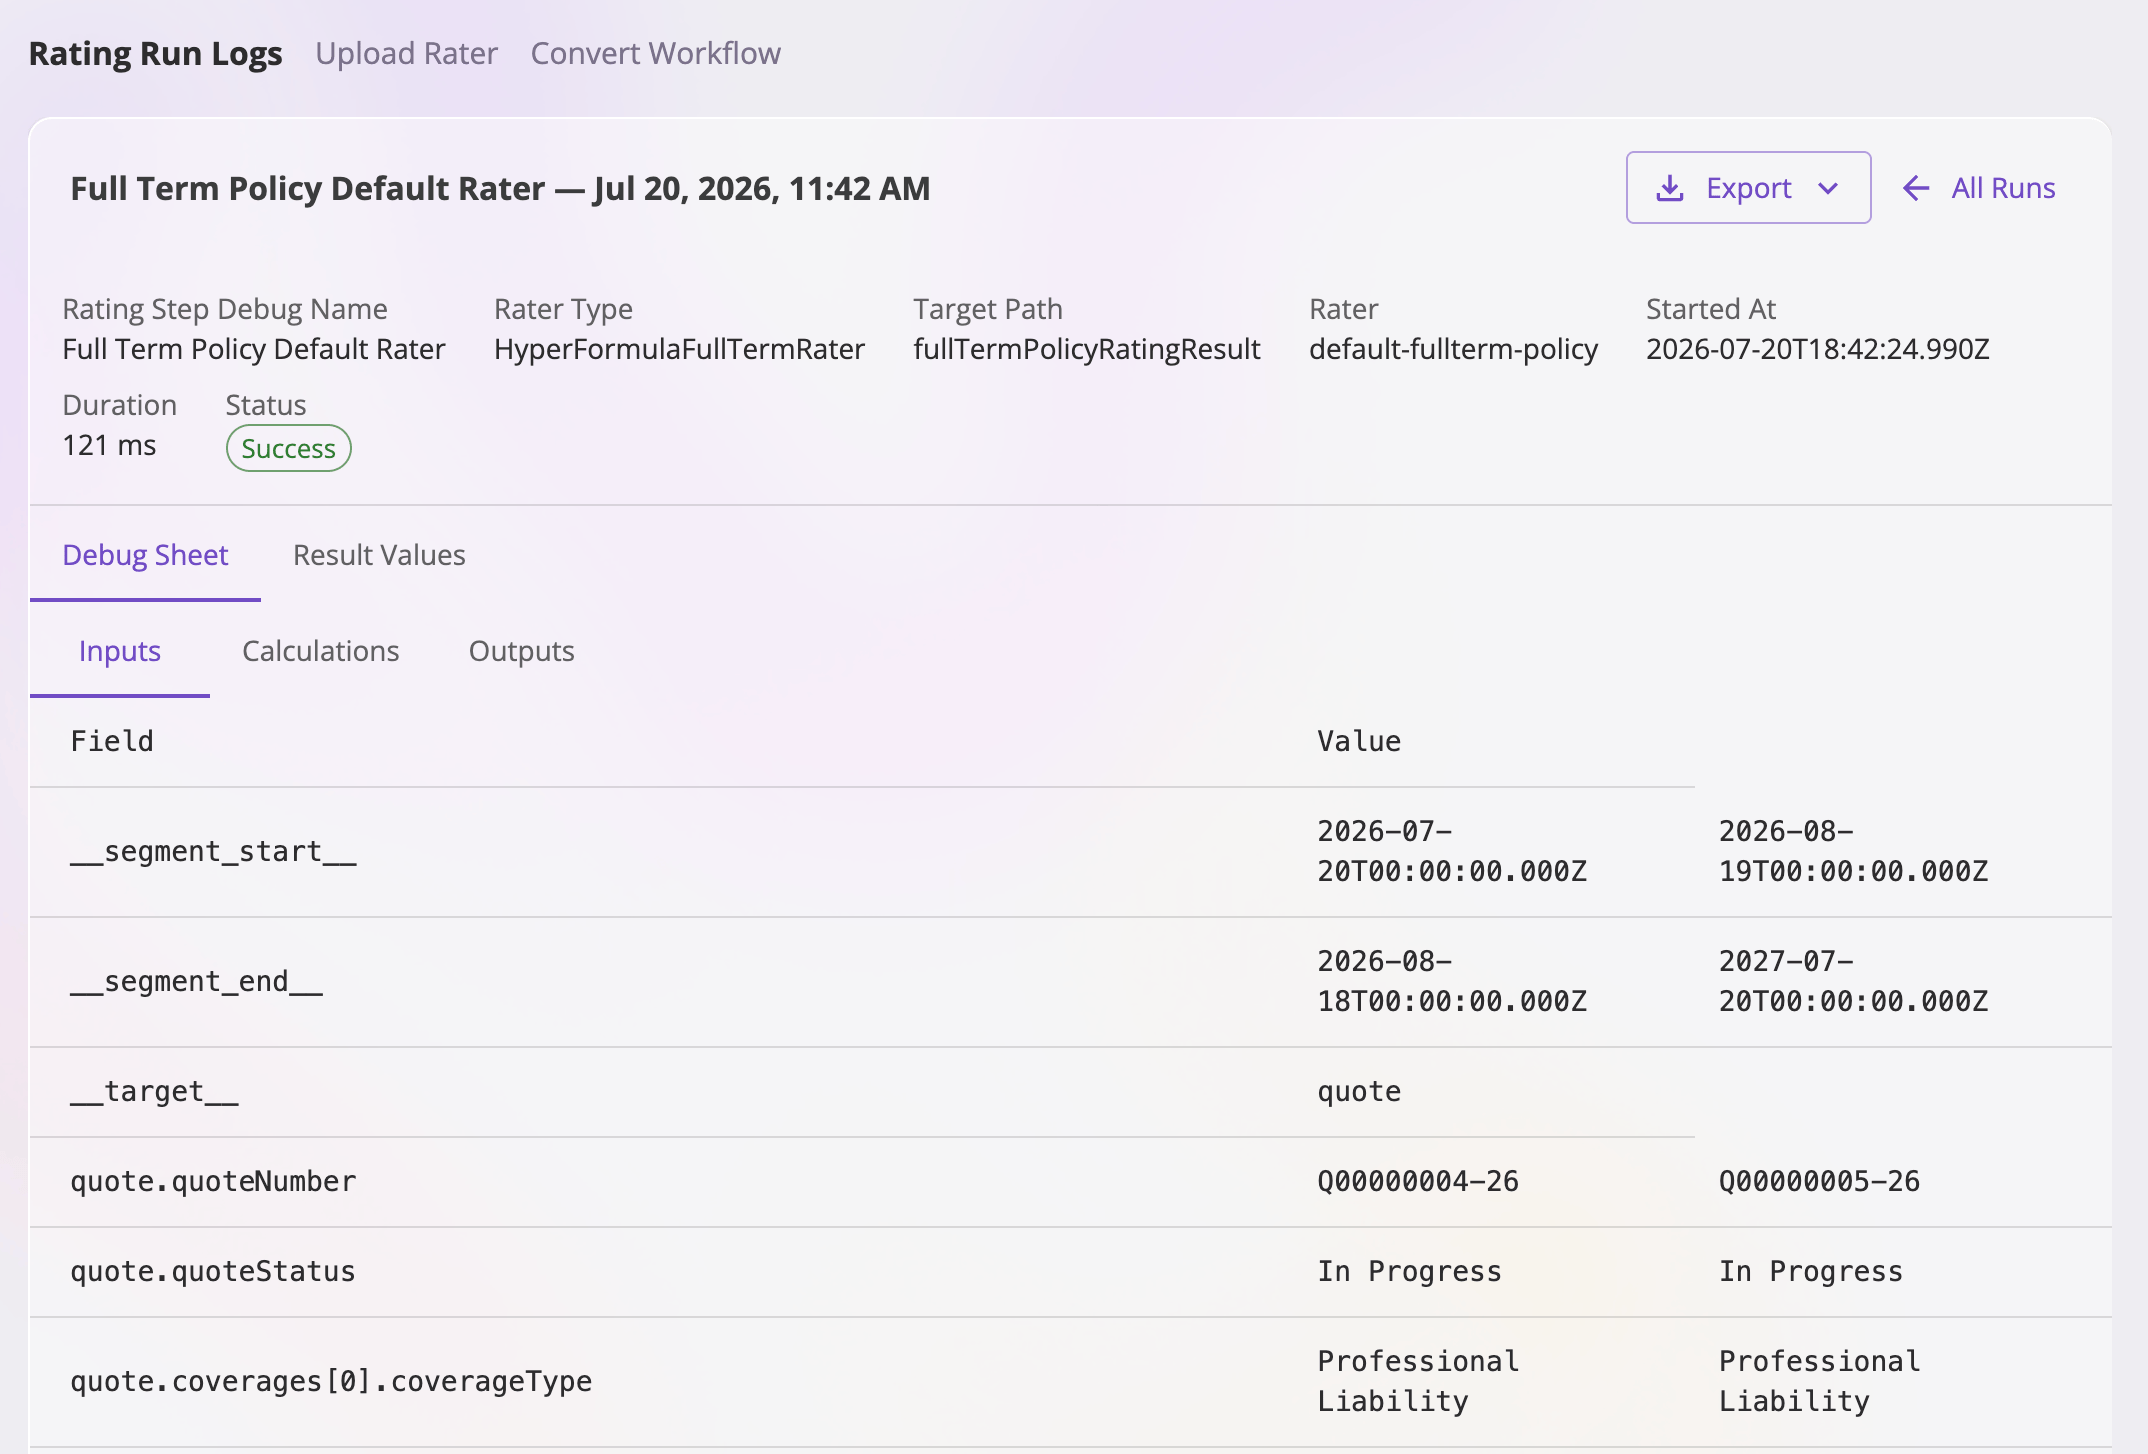
A rating run detail view showing a metadata panel with rating step debug name, rater type, target path, rater, started at, duration, and a Success status chip, above Debug Sheet and Result Values tabs and a row of sheet tabs rendered as a table.

A run's detail: metadata on top, then the artifact tabs and the sheet tabs within the selected artifact.

Metadata — the run’s identity and outcome: the rating step’s debug name, the rater type, the target path, the rater identifier, when the run started, how long it took, its status (including the failure stage and reason on a failed run), and an output-error count if any output cells errored. Debug Sheet — the full calculation worksheet exactly as it was evaluated for this run: every tab, with the inputs that were written in and every intermediate calculated cell. This is the artifact to read when you’re tracing how a number was produced. Result Values — the output values read back from the run: the numbers the quote actually received. Use this when you just need what came out. Switch between the two artifacts with the tabs above the content; within an artifact, each worksheet tab renders as its own table (scrollable for wide sheets).
A failed run only has the artifacts that existed when the failure happened — a run that failed before calculating writes no Result Values, for example. Empty artifacts are labeled as such rather than hidden.

Export a run

The Export button on the detail view (and the download icon on each list row) opens the export menu. For each artifact — Debug Sheet or Result Values — you can: The menu also offers Download meta (.json) — the run’s metadata as a file, useful when attaching a run to a support request. Artifacts a failed run never wrote are disabled in the menu; the metadata is always available.
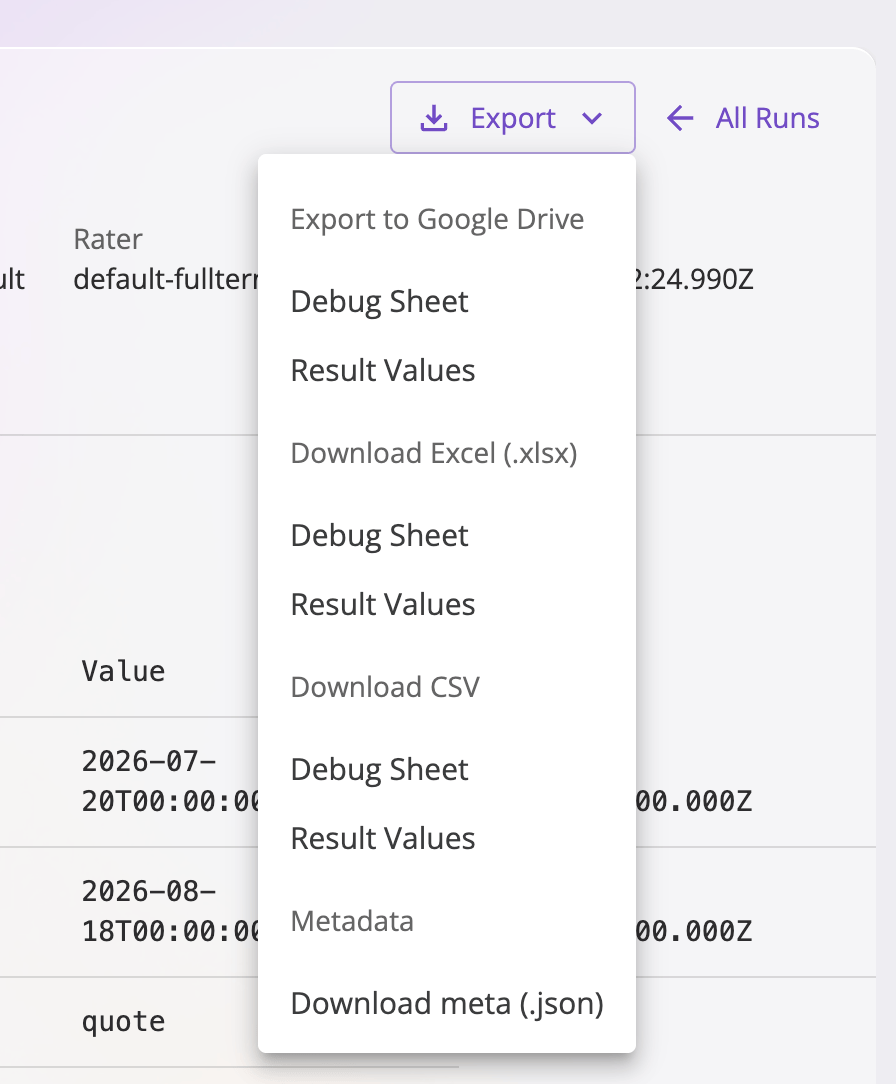
The Export menu open on a rating run, grouped by destination — Download Excel (.xlsx), Download CSV, and Export to Google Drive, each listing Debug Sheet and Result Values — with a Metadata section offering Download meta (.json).

The export menu: Excel, CSV, or Google Drive per artifact, plus the metadata file.